


New Jersey Statistics
New Jersey Substance-Use Statistics: Overdose, Treatment, and Counties
New Jersey reports overdose mortality, substance-use screening, treatment need, admissions, and county service activity as separate measures. Each measure has its own year, population, and denominator.
By Paul James Roeser·Reviewed by Noelle Mathew, LCSW, LCADC, CASAC-M·Last reviewed September 6, 2026·5 min read
Published ·Updated
New Jersey substance-use data track overdose mortality, survey screening, treatment need, admissions, and unique clients as separate measures. Each number requires its reporting year, population, unit, and source. A death count is not a prevalence rate, an admission is not necessarily a unique person, and a statewide decline does not mean every county or population improved equally.
What do New Jersey substance-use statistics measure?
DMHAS reports service activity and survey estimates; the Department of Health reports overdose mortality; and the Office of the Chief State Medical Examiner publishes a separate death series. These systems use different case definitions and revision schedules. Comparisons are valid only when the measure, denominator, and period match.
Drug addiction statistics in the United States provide national prevalence, mortality, and treatment measures, while New Jersey systems describe state-specific residents, deaths, surveys, and service episodes.
The 2023 New Jersey Household Survey collected 22,200 adult responses from October 2022 through August 2023. It estimated that 5.1% of adults met its survey criteria for substance abuse or dependence, representing about 469,345 adults when applied to the 2022 adult population estimate. The report used DSM-IV-based survey criteria, so that estimate should not be relabeled as a current DSM-5 substance use disorder diagnosis.

How many overdose deaths occur in New Jersey?
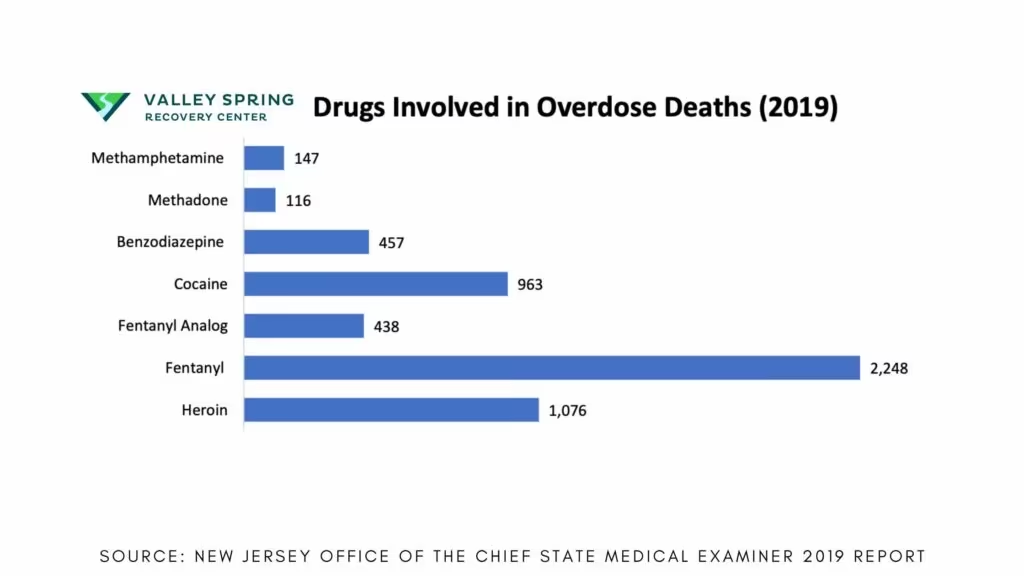
New Jersey SUDORS recorded 2,816 unintentional overdose deaths among state residents in 2023, down from 3,171 in 2022. The Department of Health reports that the decline occurred across racial and ethnic groups while the 2023 death rate among non-Hispanic Black residents remained twice the rate among non-Hispanic White residents.
The state's near-real-time medical-examiner dashboard reports unconfirmed deaths sooner than SUDORS. Its totals can differ because SUDORS uses death certificates, medical-examiner reports, and toxicology to identify confirmed unintentional overdose deaths. Substance categories can overlap when more than one drug contributed to a death.
What do New Jersey treatment-admission statistics show?
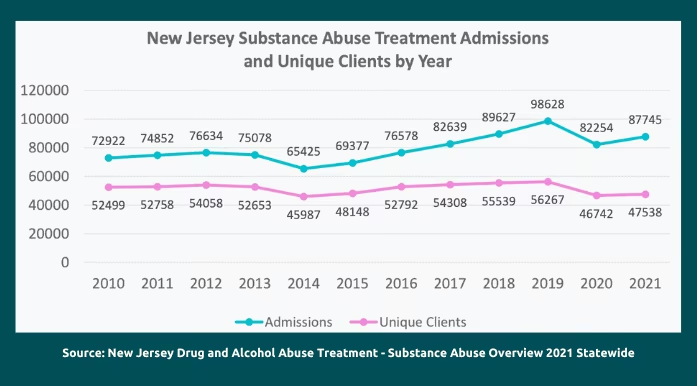
An admission is a service episode, a unique client is one identified person, and neither measure estimates every resident who needs care. DMHAS reports classify an admission by primary substance even when a person uses several substances. Readmission, transfer, and reporting practices also affect annual totals.
The 2023 household survey estimated that 5.4% of New Jersey adults needed substance-use treatment in the prior 12 months, 1.8% reported demand for treatment, and 1.5% reported unmet demand. Among adults who screened positive for abuse or dependence, 30% wanted treatment and 23% reported that they received none or less care than they wanted.
| Measure | Estimate | What it means |
|---|---|---|
| Positive abuse or dependence screen | 5.1% | Met the survey's DSM-IV-based criteria |
| Needed treatment in the prior year | 5.4% | Met survey criteria or received treatment |
| Reported treatment demand | 1.8% | Wanted treatment during the prior year |
| Reported unmet demand | 1.5% | Received none or less treatment than wanted |
How should New Jersey county statistics be compared?
County counts describe events, county rates divide a defined count by population, and treatment-site totals also reflect capacity and referral patterns. A high admission count in a populous county does not establish a higher individual risk. Small counties can also show larger percentage swings when relatively few events change.
Rates also depend on the denominator chosen for age, geography, and reporting year. New Jersey population demographics provide the age, language, household, and urban-rural context needed to interpret differences in treatment access without treating demographic identity as a diagnosis or cause.
DMHAS county reports identify treatment site, primary substance, referral source, age, and other fields. A valid comparison uses the same year and measure across counties and states whether the numerator follows residence or treatment location.

How should someone use these statistics to find help?
Population statistics identify patterns; clinical assessment determines diagnosis, immediate risk, and level of care for one person. Call 911 for a suspected overdose. A medically stable person experiencing loss of control, withdrawal, hazardous use, or continued use despite harm needs an individualized assessment rather than a county ranking.
When that assessment supports structured care while the person lives at home, outpatient addiction treatment provides clinical services without a residential stay.
Mood, anxiety, trauma, and other psychiatric symptoms require a separate measurement framework. New Jersey mental-health statistics distinguish screening, diagnosis, treatment use, and access.
Frequently asked questions
What is the newest New Jersey overdose number?
The newest number depends on whether the source reports suspected deaths or certified deaths. Check the current NJ Department of Health and DMHAS dashboards for the reporting year and revision date.
Does a treatment admission equal one person?
No. An admission is a service event, and one person may appear more than once. Use an unduplicated-client measure only when the source explicitly provides one.
Do county totals show which county is most dangerous?
No. Counts need population denominators, reporting context, and information about treatment access before they can support a rate or risk comparison.
What should I do during a suspected overdose?
Call 911 immediately, give naloxone if opioid exposure is possible, support breathing, and remain until emergency responders arrive.
Sources & References6ShowHide
- New Jersey DMHAS, 2023 New Jersey Household Survey on Drug Use and Health — State survey methods and estimates for substance use, screening criteria, treatment need, demand, and access.
- New Jersey DMHAS, Dashboard and Reports — Current statewide and county substance-use overviews and treatment performance reports.
- New Jersey DMHAS, 2021 Statewide Substance Use Overview — Historical statewide treatment-admission counts by primary substance and comparisons between admissions and unique clients.
- New Jersey Department of Health, Overdose Mortality Data Explorer — Confirmed SUDORS deaths and near-real-time unconfirmed medical-examiner data, with methodology differences disclosed by the state.
- New Jersey Department of Health, 2023 overdose mortality update — The official 2023 SUDORS count, comparison with 2022, and racial and ethnic disparities.
- New Jersey Department of Human Services, Naloxone information — Overdose recognition, naloxone access, and emergency-response guidance.