
Drug addiction is a complex disease that impacts the brain, making it challenging for individuals to cease drug use. It's important to note that addiction isn't limited to illegal substances alone.
Prescription opioids, often used as pain relievers, can also lead to addiction. Most of addictive substances increase dopamine, and eventually, the user’s body develops tolerance to the drug according to the Hazelton Betty Ford Foundations Butler Center for Research. Therefore, the intake dosage increases over time to experience the same level of euphoria.
Understanding the statistics related to drug addiction and overdoses is crucial. It raises awareness about the problems arising from substance abuse and encourages vigilance.
Moreover, being informed about these statistics empowers individuals to either seek help for themselves or assist others in finding the right support and making knowledgeable choices regarding treatment options.
Overview of Drug Addiction Statistics
Drug addiction affects millions of people worldwide with 1 in every 17 people in the world reporting to have consumed drugs for various reasons, and the estimated number of users has grown to a staggering 296 million people from 219 million users worldwide, which can be partly attributed to the population growth according to UNODC 2023 reports.
- The figures depict that a total of 5.3% of the global population aged between 15 and 64 have used drugs at some point in their life. These figures have only grown with time, with 46% of countries reporting that cannabis stands in first place in provoking drug use disorders.
- Cannabis is followed by opioids, which are ranked first in about 30% of the countries, while amphetamine-type stimulants are ranked first in 13% of the countries.
- Among people aged 12 or older in 2021, 8.6 percent (or. 24.0 million people) had at least one drug use disorder in the past year according to SAMSHA's 2021 National Survey on Drug Use in the United States.
- Opioids, particularly synthetic types like Fentanyl, represent a significant portion of drug abuse, with a reported 808,000 users of heroin in the U.S. alone in 2018.
- Prescription tranquilizers and sedatives are misused by millions, with 5.7 million people misusing prescription tranquilizers and another 1 million misusing prescription sedatives as of 2018.
- Stimulant abuse includes both illegal drugs and prescription medications, with 1.8 million persons in the U.S. reporting methamphetamine use, and 5.5 million reporting cocaine use in 2018.
- Alcohol, a legal substance, is responsible for over 95,150 deaths annually, yet less than 8% of the 15 million individuals with Alcohol Use Disorder (AUD) receive treatment.
Demographics and geography play a pivotal role in exposing different population segments to drugs. The table below showcases the top ten countries ranked by their drug usage.
What Are The Different Types of Drugs and Their Usage Statistics?
Drugs are classified into three categories: prescription drugs, prescribed for medical conditions; illicit drugs, illegal to possess or use, like heroin and cocaine; and over-the-counter drugs, available without a prescription but potentially harmful when misused like alcohol and nicotine. Each drug type has both short-term and long-term effects on the body, with varying consequences depending on the specific drug and usage patterns.
Opiate Abuse
Narcotic abuse primarily revolves around opioids, which can be classified into three categories: naturally sourced, synthetic, and semi-synthetic opioids. In 2018, as many as 808,000 persons reported using heroin, a naturally sourced opioid, in the past year, accounting for 0.3% of the population.
- Naturally sourced opioids: Derived from poppies (Papaver somniferum)
- Synthetic opioids: Created in labs; examples include methadone, fentanyl, and meperidine
- Semi-synthetic opioids: Morphine, codeine, heroin, oxycodone, hydrocodone, and hydromorphone
Fentanyl Abuse
- Fentanyl is a synthetic opioid approved by the FDA for pain relief and as an anesthetic. However, its abuse potential has skyrocketed, making it one of the most dangerous narcotics today.
- Since its inception in 2014, the fentanyl crisis in the United States has evolved significantly. The diversity in the supply chain has expanded, with new countries contributing to the global distribution of fentanyl, its analogs, and precursors.
- China continues to be the dominant supplier of fentanyl and its related compounds. These substances typically enter the U.S. through international postal services and express shipping channels.
- When it comes to fentanyl crossing the U.S.-Mexico border, the concentration in smuggled pills and tablets is generally below 10%. Mexico has been ramping up its production of fentanyl-infused tablets, which are often smuggled in high volumes but low concentrations. Seizures by the kilogram usually reveal a fentanyl concentration of less than 10%.
- In the year 2021, U.S. hospitals admitted 22,774 patients for non-lethal opioid overdoses, translating to an annual rate of 19.0 admissions per 100,000 people.
- Moreover, the death toll from drug overdoses involving synthetic opioids like fentanyl and its analogs reached a staggering 71,000 in 2021. This is a monumental increase when compared to the 730 deaths attributed to synthetic opioids back in 1999.
Heroin Abuse
Heroin, originating mainly from Mexico and a significant cause of overdose deaths, has seen varied impacts across the US, with New York as a major market, substantial use among state prisoners, and significant treatment admissions in New Jersey, despite a recent decline in overdose deaths.
- New York is considered as the state with the largest heroin market and distribution network in the US.
- Mexico was the main country of origin for the heroin found in the United States.
- Along with methamphetamine and cocaine, heroin is one of the three narcotics that are most frequently injected in the United States.
- In 2018, opioids, including heroin, were involved in almost 70% of drug overdose deaths.
- In state prisons, almost 22% of the female inmates admitted to regularly using heroin.
- In New York, the percentage of all overdose deaths containing heroin fell to 37% between 2020 and 2021.
- From 2011 to 2019, the number of heroin-related opioid overdose deaths per 100,000 Californians increased from 0.9 to 2.2.
- 42% of all admissions to drug and alcohol treatment facilities in New Jersey were due to heroin addiction.
- Heroin-related overdose deaths have increased in recent years, but there was a decrease in deaths since 2016, with 9,173 deaths reported in 2021.
The heroin addiction statistics show that heroin is one of the most widely used illicit drugs which account for the highest overdose rates when mixed with fentanyl or xylazine.
Hydrocodone (Vicodin) Abuse
Hydrocodone, commonly known by its brand name Vicodin, is another opioid that has seen a surge in abuse. The Substance Abuse and Mental Health Services Administration (SAMHSA) reports that nearly 11.5 million people misused prescription opioids like Hydrocodone in 2016.
- The US is the major abuser of hydrocodone.
- Hydrocodone products are the most commonly misused subtype of prescription pain relievers.
- Around 11 million people have used pain relievers without a prescription in 2018.
- Women are more likely than men to use prescription pain relievers.
- Middle-aged women are more likely to die from a prescription opioid overdose than other age groups.
- Friends or relatives were the most common source for those who have misused prescription pain relievers.
- People with a history of alcohol or substance abuse are more likely to misuse prescription opioid medications.
- 2020 saw more than 56,000 deaths involving prescription opioid pain relievers such as Vicodin.
- 5.5 million people misused hydrocodone in 2018.
- The highest opioid dispensing rate occurred in 2012 with 81.3 prescriptions per 100 people.
Hydrocodone Addiction Statistics increased in the early 2000's and have started to trend down since their peak prescription rate in 2012 as regulation has been enacted to prevent further abuse.
Depressant Abuse
Depressants are used medically to induce sleep and alleviate conditions like anxiety and muscle spasms. In 2018, a concerning 5.7 million people reported misuse of prescription tranquilizers, while another 1 million misused prescription sedatives.
Prolonged use of depressants can lead to physical dependence even at doses recommended for medical treatment. Unlike barbiturates, large doses of benzodiazepines are rarely fatal unless combined with other drugs or alcohol.
DEA
Types of Depressants
- Barbiturates: Butalbital, phenobarbital, and pentothal
- Benzodiazepines: Valium, Xanax, Halcion, Klonopin
Alcohol Abuse
Though legal, alcohol claims over 95,150 American lives annually. Among the 15 million individuals with Alcohol Use Disorder (AUD), less than 8% receive treatment.
According to the 2021 National Survey on Drug Use and Health (NSDUH), 29.5 million people ages 12 and older (10.6% in this age group) had AUD in the past year. This includes:
- 16.6 million males ages 12 and older (12.1% in this age group) (SAMHSA)
- 13.0 million females ages 12 and older (9.1% in this age group)(SAMHSA)
- 18.7 million White people ages 12 and older (11.0% in this age group)(SAMHSA)
- 3.5 million Black or African American people ages 12 and older (10.1% in this age group)(SAMHSA)
- 280,000 American Indian or Alaska Native people ages 12 and older (15.6% in this age group)(SAMHSA)
- 144,000 Native Hawaiian or other Pacific Islander people ages 12 and older (14.0% in this age group)(SAMHSA)
- 982,000 Asian people ages 12 and older (6.0% in this age group)(SAMHSA)
- 790,000 people of two or more races ages 12 and older (14.7% in this age group)(SAMHSA)
- 5.1 million Hispanic or Latino people ages 12 and older (10.3% in this age group)(SAMHSA)
Stimulant Abuse
Stimulants, both legal and illegal, are widely abused with 1.8 million persons in the US, or 0.7% of those 12 years and older, reported methamphetamine use in 2018. Additionally, 2% or 5.5 million persons reported using cocaine in the same year according to DrugAbuseStatistics.org.
- Rise in Stimulant Use Nationwide: The United States is witnessing a surge in the misuse of stimulants. According to the latest figures from the National Survey on Drug Use and Health (NSDUH), 2020 saw an estimated 5.1 million individuals aged 12 or older misusing prescription stimulants. This data is particularly relevant for Nevada, given its role in the national opiate response.
- Young Adult Demographics Most Affected: Among various age groups, young adults between the ages of 18 and 25 are the most prone to prescription stimulant misuse. This trend is crucial for targeted interventions in Nevada, especially among college students and young professionals.
- Methamphetamine Use on the Rise: The data reveals that approximately 2.6 million people aged 12 or older consumed methamphetamine in the past year. This marks a significant increase of over 36% since 2018, indicating a growing concern for Nevada's public health officials.
- Decline in Cocaine Use: Interestingly, the number of individuals aged 12 or older who used cocaine in the past year has decreased. The figure stands at 1.8 million, showing a notable decline from 2018. While this may seem like a positive development, it could also indicate a shift towards other types of stimulants, which is a point of consideration for New Jersey's opiate response strategy.
Commonly Abused Prescription Stimulants:
- Adderall: Leads to almost 1,500 emergency room visits every year
- Ritalin: Serves as a potential gateway drug to harder substances
- Vyvanse: Despite low initial abuse potential, nonmedical use is prevalent among adolescents
Hallucinogen Abuse
Hallucinogens like ketamine, mushrooms (Psilocybin), LSD, and MDMA have limited to no medical use in the United States, making them primarily illegal. LSD is noted as one of the most dangerous hallucinogens, causing serious long-term damage.
Marijuana Abuse
Marijuana is technically classified as a hallucinogen under the Controlled Substances Act. Approximately 18.7% of Americans over the age of 18 use marijuana at least once over a 12-month period. While it remains illegal under Federal law, according to DEA releases 2020 Drugs of Abuse Resource Guide it is legalized for recreational use in 15 states, generating billions in sales.
- Prevalence of Marijuana Use: According to the Office Of National Drug Control Policy, Marijuana holds the title of the most frequently used illegal drug in the United States. In 2011, over 18 million Americans aged 12 and older admitted to using marijuana in the past month. This statistic is vital for understanding the scope of drug use, especially for states like New Jersey that are grappling with substance abuse issues.
- Diagnostic Criteria for Abuse: Around 4.2 million individuals met the diagnostic standards for marijuana abuse or dependence. This number surpasses the combined total for pain relievers, cocaine, tranquilizers, hallucinogens, and heroin, making it a focal point for substance abuse treatment and policies in New Jersey.
- Emergency Department Visits: In 2010, marijuana was a contributing factor in approximately 461,000 emergency room visits across the U.S. This accounts for nearly 39% of all ER visits related to illicit drug use, underscoring the genuine risks associated with marijuana consumption.
- Treatment for Marijuana Use: In 2011, about 872,000 Americans aged 12 or older sought treatment specifically for marijuana use, more than for any other illegal drug. This statistic challenges the notion that marijuana is harmless and emphasizes the need for comprehensive drug education and treatment programs, particularly in states like New Jersey.
- Contradicting the "Harmless" Narrative: Despite some public opinions suggesting that marijuana is benign, these statistics paint a grim picture of the real and significant dangers associated with its use. This data serves as a cautionary tale for policymakers and healthcare providers in New Jersey, urging them to consider the full spectrum of marijuana's impact on society.
What Are The Drug Overdose Statistics?
Overdose occurs when a person takes an excess amount of drug than recommended. Overdose usually involves a lethal amount of drug intake, which can produce rapid or delayed symptoms and eventually result in death.
There are two prevalent causes of overdoses:
- Accidental Overdose - This overdose occurs when a person unknowingly consumes an excessive amount of drugs.
- Intentional Overdose - Intentional overdose occurs when a person deliberately consumes a lethal quantity of a drug to cause self-harm.
Overdose accounted for about 25% of the total 500,000 drug-related death cases in the world in 2019, with opioids taking the reigns in causing fatal overdoses.
The United States itself witnessed about 80,000 deaths due to opioid overdose, which shows the extent to which these drugs can harm civilizations according to studies from the DEA, CDC and SAMSHA.
Surveys have revealed that 71% of opioid overdose deaths occurred between the ages of 24 and 54, with the number of male deaths being 2 or 3 times the number of female deaths.
What Is The Influence of Substance Use on Violent and Sexual Offenses?
The role of substance use in criminal activities, particularly violent and sexual offenses, is significant. Moreover, drugs are often employed to incapacitate victims in sexual offenses.
- Approximately three-quarters of individuals entering treatment for substance use disorders admit to participating in violent acts. Such acts range from armed robbery and aggravated assault to sexual assault and homicide. (Source: Science Direct)
- A staggering 160,000 female college students have been victims of drug-enabled sexual assault. In 20% of these cases, physical harm was reported. (Source: U.S. Department of Justice)
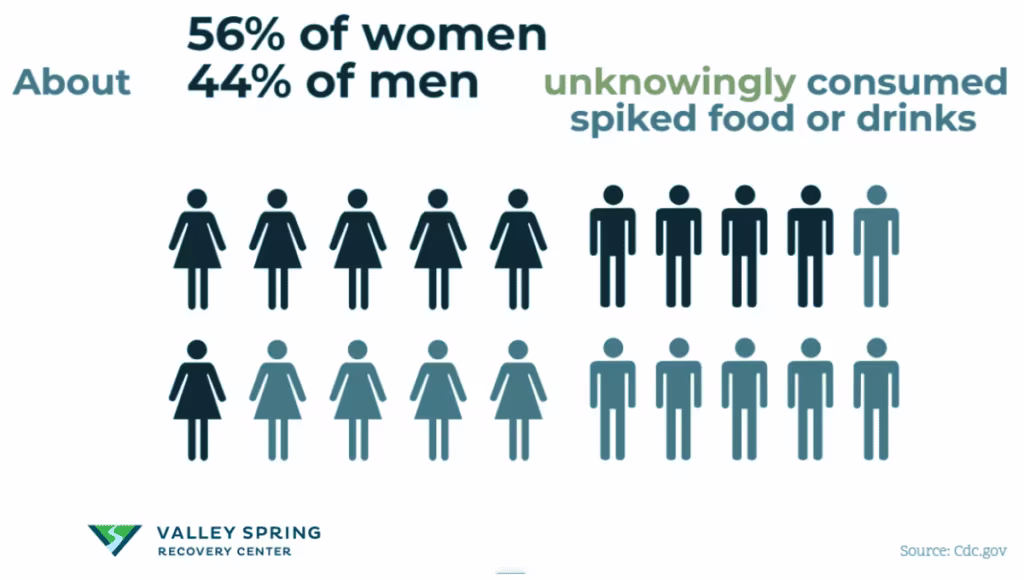
- Over half of women (56%) and nearly half of men (44%) have unknowingly ingested tampered food or beverages. Substances like Rohypnol, GHB, and ketamine are commonly used to impair victims, leading to delayed awareness of the assault. (Source: American Addiction Centers)
- Around 75% of so-called "acquaintance rapes" involve the use of substances, including alcohol. The lethal mix of alcohol and drugs is increasingly being used as a tool to incapacitate victims for sexual offenses. (Source: West Virginia Foundation for Rape Information and Services)
- In about two-thirds (67%) of sexual assault cases, the assailants were under the influence of substances. Contrastingly, only 38.1% of the victims were under the influence at the time of the incident. (Source: National Library of Medicine)
These statistics underscore the urgent need for intervention and preventive measures, particularly in the context of substance use and its role in violent and sexual crimes
How Much Of The US Workforce Has Addiction Issues?
Addiction is a pervasive and multifaceted issue that goes beyond personal lives, extending its reach into entire communities and industries.
- Nearly 8.7 percent of full-time workers aged 18 to 64 reported having a substance use disorder (SUD) in the past year. This prevalence varies across industries, with construction witnessing as high as 16.5%, compared to 4.3% in education services.
- Age and gender also play significant roles in drug addiction rates, with younger workers and males generally experiencing higher rates.
- Substance abuse costs employers over $81 billion annually in lost productivity and additional healthcare costs, According to the National Safety Council
The economic impact of substance abuse in the workplace is tangible, leading to decreased productivity, increased absenteeism, and elevated healthcare costs. Recognizing the urgency of the workforce addiction issue, the importance of workplace prevention and intervention programs has been emphasized, and recommendations include implementing evidence-based workplace policies and programs.
The insights found in our article on workplace addiction statistics provide an in-depth analysis of how addiction influences various job sectors and offer guidance on addressing these serious challenges.
What Are The Different Types of Addiction?
Substance Addictions
These encompass addictions to various substances that can be consumed or ingested:
- Alcohol: A legal but highly addictive substance.
- Illegal Drugs: Includes substances like cocaine, heroin, methamphetamine.
- Prescription Medications: Abuse of painkillers, sedatives, and stimulants.
Behavioral Addictions
These addictions involve compulsive engagement in behaviors:
- Gambling: Compulsive gambling despite negative consequences.
- Internet/Gaming: Excessive use of the Internet, including online gaming.
- Eating Disorders: Anorexia, bulimia, or binge eating.
Co-occurring Disorders
- Definition: Simultaneous occurrence of mental health and addiction disorders.
- Impact: More complex to treat as each disorder can exacerbate the other.
How Many Drugs Are Consumed Daily By Country?
Drug consumption can be quantified through various methods, and one of the methods that we will be exploring here is the Disability-Adjusted Life Years (DALYs). This represents the number of healthy years of life that are lost due to drug consumption, and this is then averaged across the total population of the country.
These statistics are collected through various sources such as self-reports, medical records, and surveys. In addition, the member states also submit Annual Reports and Questionnaires to the United Nations Office on Drugs and Crime. The UNODC then compiles these reports to produce elaborate executive summary reports outlining all the drug-associated statistics and trends.
| Country | DALYs (As of 2019) |
| United States | 6.70 |
| Estonia | 5.00 |
| Belarus | 4.10 |
| Mongolia | 4.00 |
| Canada | 3.90 |
| Greenland | 3.90 |
| Russia | 3.80 |
| Kazakhstan | 3.70 |
| United Arab Emirates | 3.70 |
| Denmark | 3.60 |
What Are Addiction Treatment Options?
Addiction treatment options are varied and often tailored to meet the unique needs and circumstances of each individual. Here are some of the most common types of addiction treatment options to expect:
- Medical Detox: This is usually the first step in many treatment programs. Under medical supervision, substances are safely removed from the body, ensuring that the patient is physically stable before proceeding to other forms of treatment.
- Inpatient Drug Rehab: This involves residential treatment where patients stay at a facility and receive intensive care. Inpatient treatment often includes medical observation, detoxification, therapy, and other forms of support in a controlled environment.
- Partial Care Program (PC): Also known as "day treatment," PC is a more intensive form of outpatient care that allows individuals to access high-level medical and therapeutic care while living at home or in a sober living environment.
- Intensive Outpatient Program (IOP): Patients who are stable enough to live at home but still require significant treatment may opt for an IOP. This program involves attending treatment sessions for several hours a day but allows patients to carry on with their daily activities.
- Outpatient Treatment: This flexible option is suitable for individuals who have a strong support system at home and only need therapy or counseling services. Outpatient treatment can be customized to fit around work, school, and family commitments.
- Long-term Residential Treatment: For severe addictions, long-term residential options offer extended care that can last several months or even years.
- Therapy and Counseling: This includes a range of approaches such as individual therapy, group therapy, and family therapy. Cognitive Behavioral Therapy (CBT), Dialectical Behavior Therapy (DBT), and Motivational Interviewing are often used in these sessions.
- Alternative Therapies: These can include holistic approaches like acupuncture, art therapy, equine therapy, and mindfulness meditation as complementary treatments.
- Aftercare and Alumni Programs: Crucial for long-term recovery, these programs offer ongoing support, resources, and community to help prevent relapse.
Concluding Insights: The Grim Reality and Urgent Need for Action
The data on drug abuse presents a sobering picture of the multifaceted challenges we face as a society. The abuse of narcotics like opioids remains a dominant issue, with synthetic options like Fentanyl posing a particularly high risk. Depressant abuse, often overlooked, has millions entangled in its web, manifesting in the misuse of prescription tranquilizers and sedatives. Stimulant abuse is a growing concern, extending from illegal drugs like methamphetamine to prescription drugs like Adderall, or Percocets affecting millions in the U.S. alone. Meanwhile, alcohol, a socially accepted substance, takes the lives of over 95,150 Americans each year, highlighting the disconnect between societal norms and the real-world devastation caused by substance abuse. According to the 2019 National Survey of Drug Use and Health (NSDUH) Releases, less than 8% of those with Alcohol Use Disorder are receiving the treatment they need. These statistics serve not only as an eye-opener but also as a clarion call for comprehensive strategies to tackle drug abuse on multiple fronts. The ubiquity and severity of these issues underline the imperative for effective prevention, education, and treatment programs, tailored to the unique challenges posed by each category of substance abuse.